Highlights of the Investment Spreads Report: Q1 2020
Overview
Members of the Federal Home Loan Bank of Chicago (FHLBank Chicago) maintain investment portfolios as a source of liquidity and additional income, as well as for asset/liability management. In this paper, we comment on FHLBank Chicago’s
Investment Spreads report and how these spreads relate to advances. As your trusted advisors, we hope to provide insights into the bond market for highly rated securities typically available to our members. FHLBank Chicago advance borrowings can help fund investment strategies using these assets, and contribute to the bottom line. In many cases, the use of swaps in fair-value or cash-flow hedge strategies can enhance financial institutions’ income and help manage their interest-rate risk.
Historical Spread Comparison
Pages 1 and 2 of the report compare the spreads of various securities. The measures used include swap spread, LIBOR option-adjusted spread (LOAS), and discount margin. The spread type is based on the category of the security and the benchmark by which it’s measured. For example, non-mortgage-backed-security investments with bullet cash flows are typically measured by the spread over swaps. In contrast, MBS pass-through investments have embedded options that allow for prepayment, so those assets are compared using LOAS.

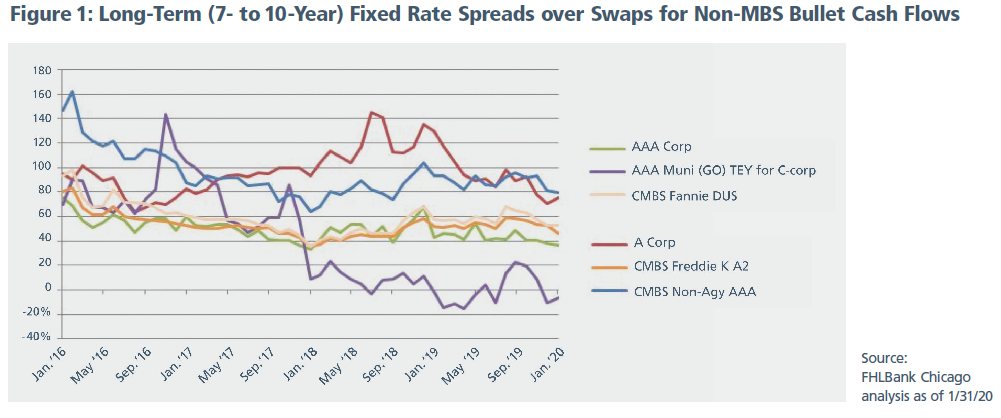
Figure 1 is an example of a historical spread comparison chart. Various investment-grade fixed rate bonds typically available to members are displayed here. The spreads are recorded on the last day of each month. The asset categories include corporate bonds (corp), municipal bonds (muni), and commercial mortgage-backed securities (CMBS).
Members can compare these assets of similar duration and structure to help value risk and reward. For example, senior non-agency CMBS rated AAA had a spread of 80 basis points over swap rates as of January 31, 2020—the highest spread of the bonds displayed in the long-term fixed category. However, members may or may not be comfortable with the risks of that sector. They may instead prefer the agency guarantee of Fannie Mae Delegated Underwriting and Servicing (DUS) bonds, with a spread of 53 basis points. Alternatively, members may wait for other historically high-spread assets, such as single A corporate bonds, to return to levels seen in 2018. Some insights from the report may lead members to avoid certain asset classes. For example, AAA general obligation municipal bond spreads have turned negative to swaps on a tax-equivalent yield (TEY) basis, assuming a C corporation tax rate of 21%. Member banks may find these assets unattractive, while high-net-worth individuals at higher tax rates may prefer them.
Page 3 of the report displays the starting net interest margin (NIM) obtainable by funding assets with fixed rate advances ranging from 1 month to 10 years in duration. All the sectors within the historical spreads comparison charts are listed in this section.

As shown in Figure 2, Fannie Mae CMBS DUS bonds could earn 18 basis points over 4 years if funded with a 4-year fixed rate advance. DUS bonds are balloon amortizing cash flows with prepayment protection. The structure is designed so that the borrower pays interest amortized over many years (typically 25 to 30), but with the full principal due back in a shorter time (typically 10 years), referred to as a balloon payment. The borrower would have to pay a penalty in order to prepay. The bond’s interest rate is fixed, and matches well with fixed rate advances.

As shown in Figure 3, AAA floating rate collateralized loan obligations (CLOs) float off the 3-month LIBOR rate with a discount margin of 126 basis points. In other words, holders of AAA CLOs would earn a yield of 3-month LIBOR + 126 basis points. This security could be match-funded with a 4-year, 13-week discount note floater and earn a spread of 83 basis points. Alternatively, members could take a 3-month fixed rate advance to earn a spread of 118 basis points to start, and then continue to roll the advance every three months.
Members may find investment opportunities that differ from FHLBank Chicago’s spreads listed in this report. The Solutions team will also provide customized analysis of funding options with interest rate shocks on any CUSIP purchased or being considered. Contact your Sales Director for the full Investment Spreads Report.
To Learn More
If your institution would like more specific information about these strategies, please reach out to your Sales Director at membership@fhlbc.com.Contributors

Nick Simoncelli
Senior Analyst, Sales, Strategy, and Solutions

Ashish Tripathy
Managing Director, Sales, Strategy, and Solutions
Disclaimer
The risks of using leverage strategies should be reviewed by each financial institution to ensure they do not breach any regulatory requirements and understand the characteristics of any investments and borrowings they are making before engaging in such a strategy. The scenarios in this paper were prepared without any consideration of your institution’s balance sheet composition, hedging strategies, or financial assumptions and plans, any of which may affect the relevance of these scenarios to your own analysis. The Federal Home Loan Bank of Chicago makes no representations or warranties about the accuracy or suitability of any information in this paper. This paper is not intended to constitute legal, accounting, investment, or financial advice or the rendering of legal, accounting, consulting, or other professional services of any kind. You should consult with your accountants, counsel, financial representatives, consultants, and/or other advisors regarding the extent these scenarios may be useful to you and with respect to any legal, tax, business, and/or financial matters or questions.
Federal Home Loan Bank of Chicago | Member owned. Member focused. | February 2020


